Signal Panel
The signal panel is the main workspace for viewing and labeling recordings after an experiment session is loaded.
How data is shown
Signal samples are loaded from the Ephyr experiment folder (data/sweep_*/*.samples) together with
header.json. Traces are arranged into channel groups defined in the current session’s GUI setup.
Each group can show a classic single-column stack of channels or a custom electrode grid (see Channel Management). Per-channel scale, color, Y offset, and optional clipping apply when drawing. Channel name labels on each cell can be hidden with View → Channel names.
Events and periods
On top of the traces you can place:
- Events — vertical markers at a specific time in a sweep, colored by vocabulary entry. Events can be flagged as bad. Use the Events menu for vocabulary management and interactive add / remove / bad-flag modes.
- Periods — labeled intervals (optionally spanning sweeps). Use the Periods menu to manage vocabulary and to add intervals with two clicks.
Visibility of traces, channel names, events, and periods is controlled from View and stored in the session.
Add-on overlays
Viewable add-ons draw additional graphics on the same panel after the base traces (and according to their
z-order relative to periods and events). A common example is csd (current source density) add-on.
Another example is highlighted spikes from the Spike viewer
add-on: detection results stored under add_ons/data/ are rendered as markers on the relevant channels.
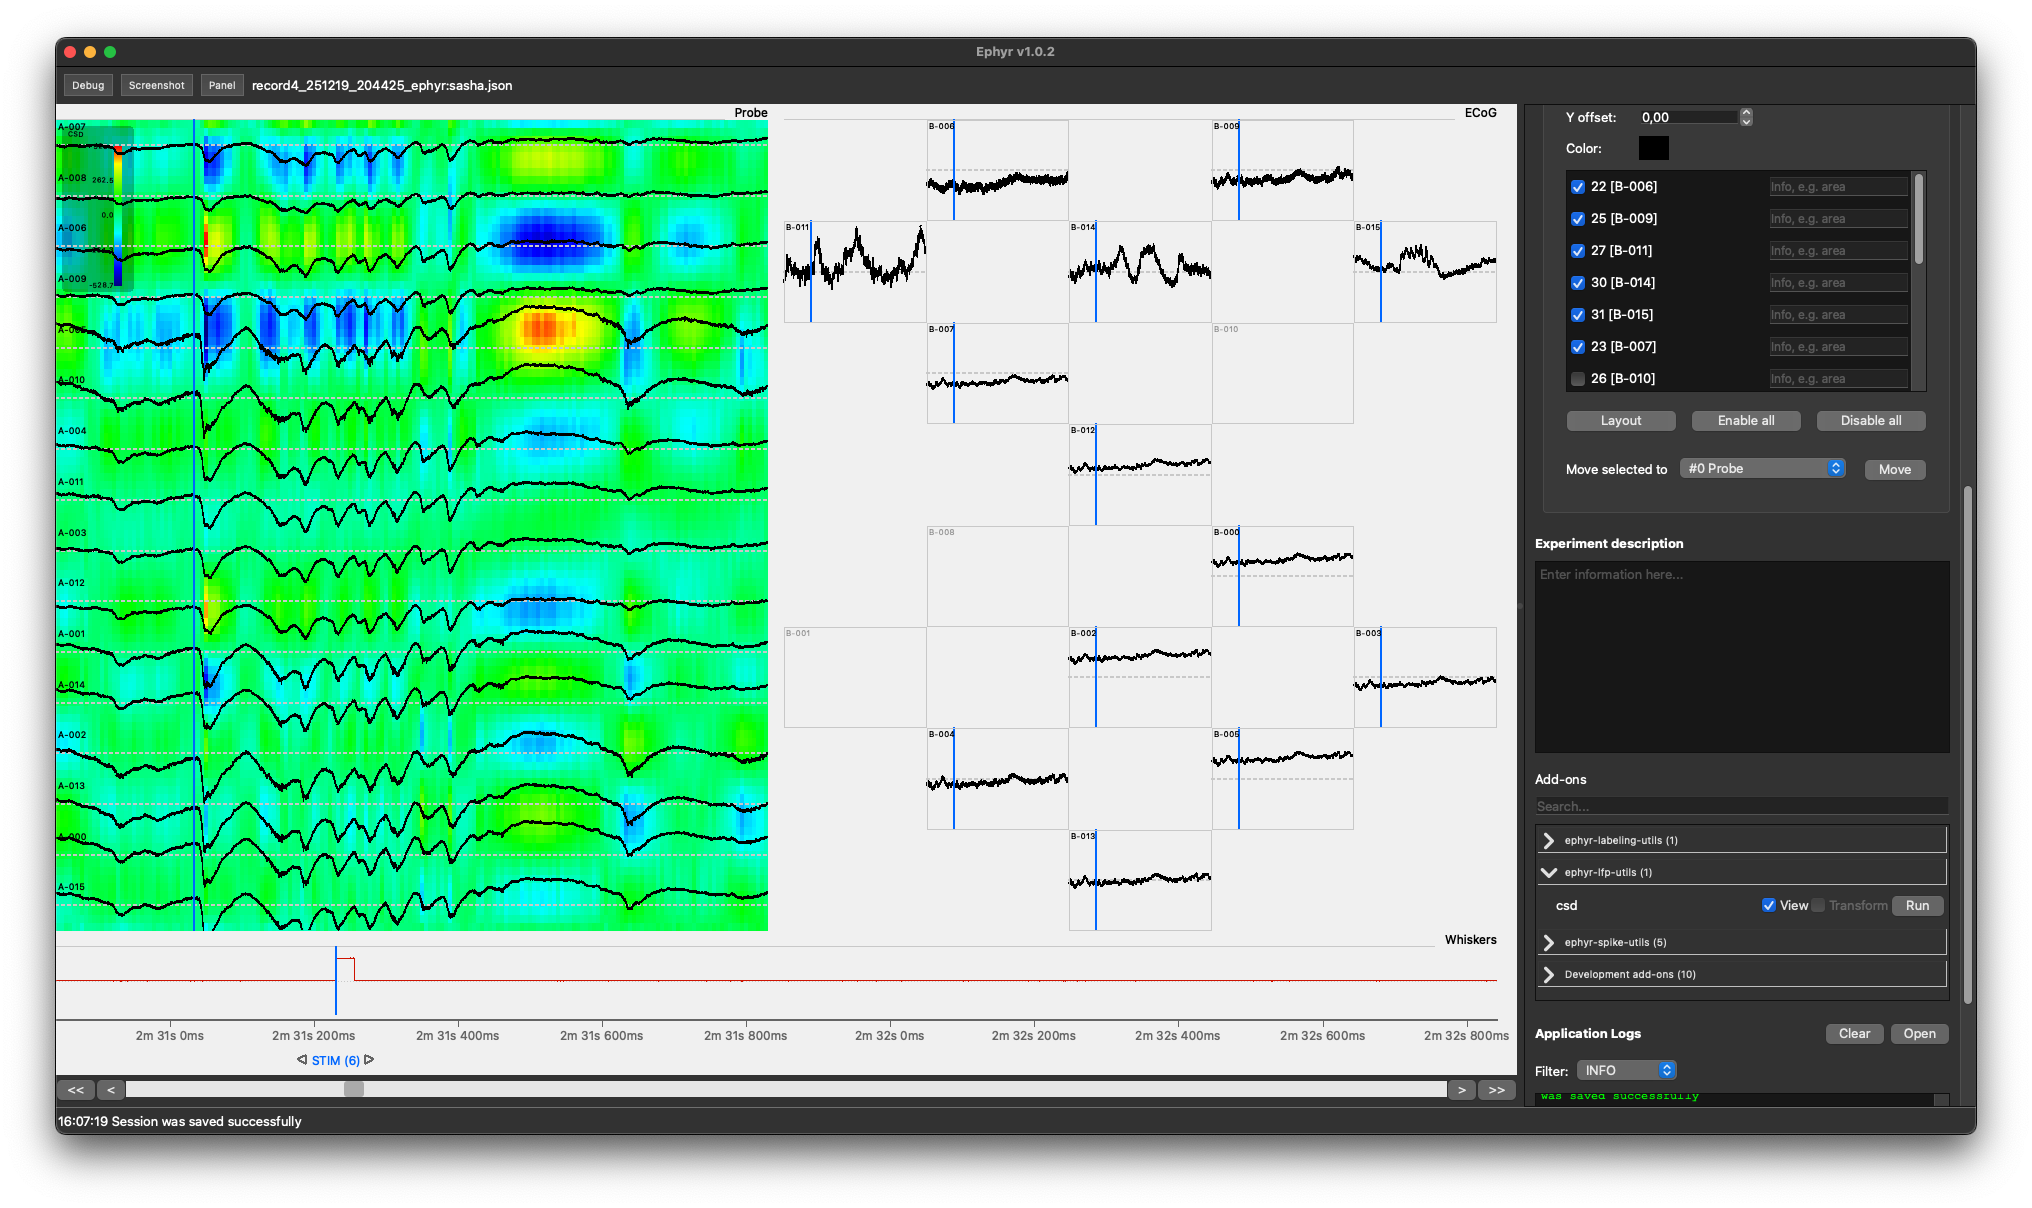
Transformation add-ons do not draw; they change the numeric samples that feed the display pipeline before filters and plotting. Runnable add-ons are started from the Add-ons settings section and may update session labels or files that Viewable tools then display.
Navigation under the plot
Below the traces:
- Event / period navigator — a strip of labels for events and period starts/ends in the current view. Arrow controls jump to the previous or next occurrence of the same event name within the sweep and recenters the time window.
- Time controls —
<<<scrollbar>>>: - Scrollbar sets the window start sample
</>step by the configured time step<</>>toggle auto-scroll using the auto-scroll interval and time step
You can also drag horizontally on the plot to pan (when not in an exclusive overlay mode) and use Ctrl/Cmd + scroll to zoom duration around the cursor.
When a channel group uses a large custom grid, a small group navigator (arrows + minimap) appears so you can pan the visible window of electrodes within that group.
Interactive tools
| Mode | How to start | What it does |
|---|---|---|
| Measurement bar | Press M (cycles: follow → freeze → off) | Crosshair with time and voltage scale bars |
| Full-view select | Press V | Two clicks define a rectangle; opens a dialog with the selected area |
| Event / period modes | Events and Periods menus | Crosshair overlay for placing or editing labels; Esc or right-click cancels |