Add-ons Workflow
Add-ons extend Ephyr without changing the core application. Each add-on is a Python class that can enable any combination of three capabilities:
| Type | What it does | Where it fits |
|---|---|---|
| Transformation | Changes the numeric samples used for display | Inside the display data pipeline, after int16→voltage conversion and before channel-group filters |
| Viewable | Draws overlays on the signal panel | In the paint stack, layered with traces, periods, and events according to a z-index |
| Runnable | Runs an interactive or batch tool when you click Run | Outside the continuous redraw loop; reads the session and data, may write under add_ons/data/<module>/, and may open dialogs |
One package can combine capabilities (for example Runnable + Viewable).
Logical data flow
flowchart LR
  raw[Raw_memmap] --> volt[Voltage_conversion]
  volt --> transform[Transformation_add_ons]
  transform --> filters[Group_filters]
  filters --> display[Display_buffer]
  display --> paint[Paint_stack]
  paint --> viewable[Viewable_add_ons]
runnable[Runnable_add_ons] --> sessionData[Session_and_add_ons_data]- Raw int16 samples are read from
data/sweep_*/*.samples. - Values are converted to voltage for display.
- Enabled Transformation add-ons reshape those samples per channel (when applicable).
- Channel-group filters run next.
- The result is downsampled into the display buffer drawn as traces.
- Viewable add-ons paint additional graphics on top (or underneath, depending on z-index).
- Separately, Runnable add-ons are started from the Add-ons panel. They can detect events, compute analyses, or write result files that other Viewable tools later overlay.
Session toggles for View / Transform are stored in gui_setup.add_ons. Persistent outputs usually live
under {experiment}_ephyr/add_ons/data/$ADD_ON_MODULE_NAME/.
Example: Viewable — Spike viewer
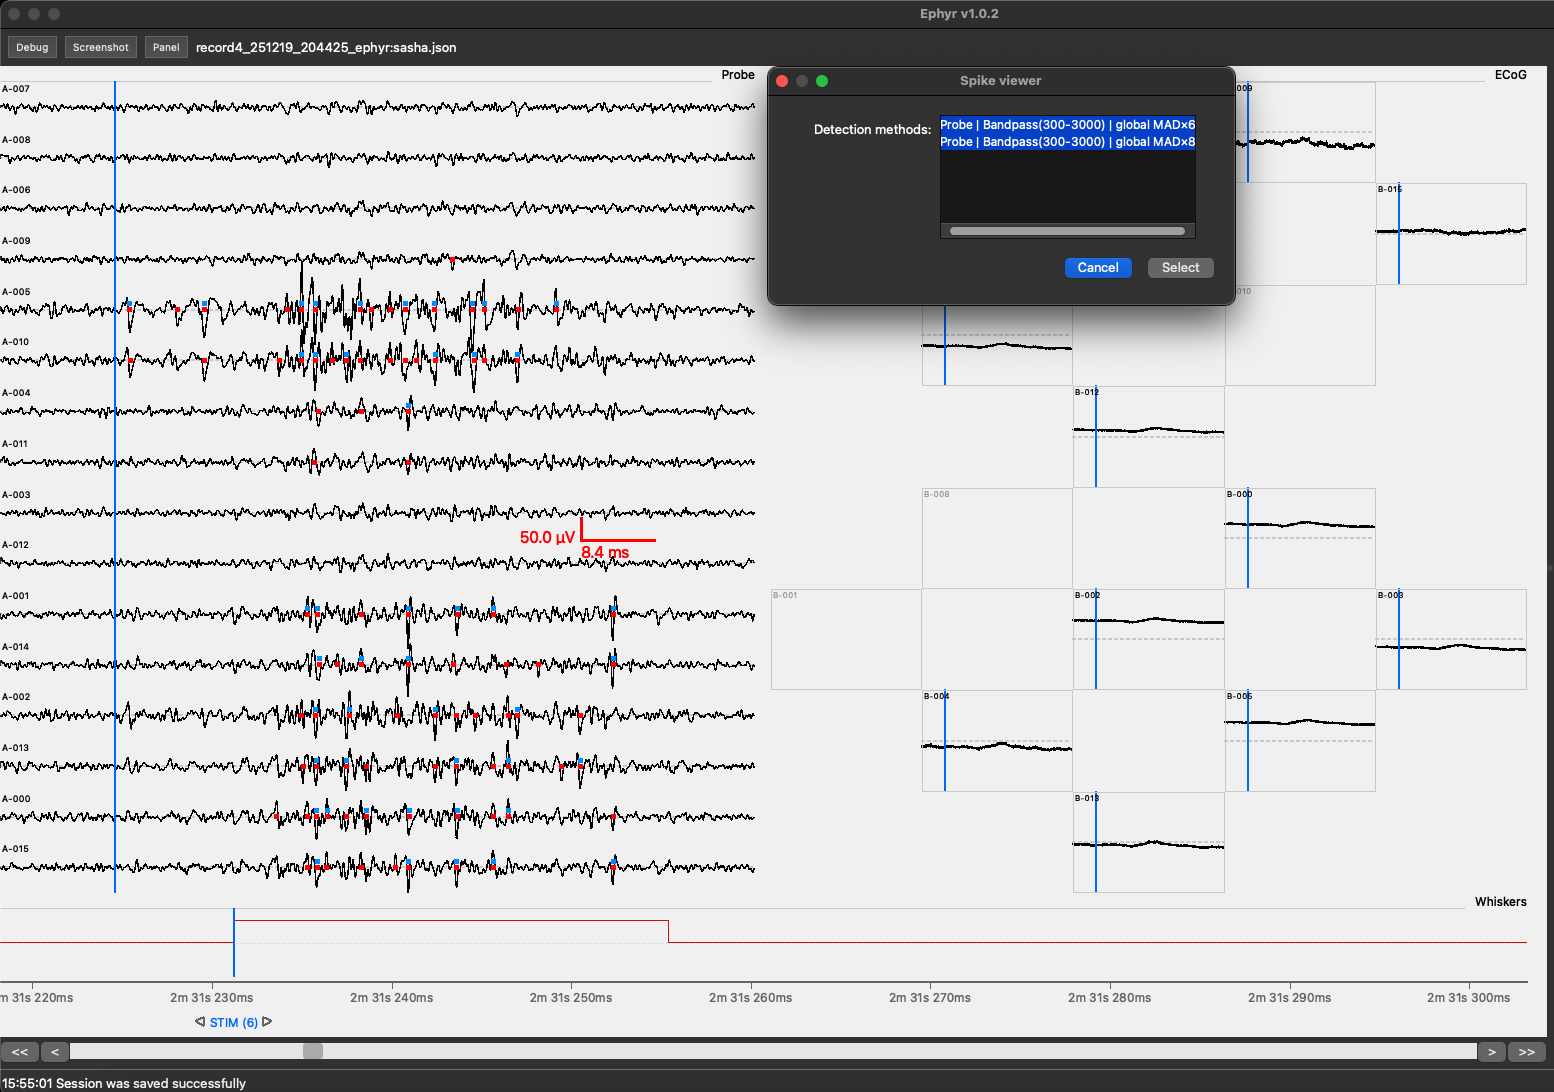
Spike viewer overlays spike markers on the signal panel from detection results produced by Spike detection (or compatible tools). You typically Run it once to choose which detection result folders to display, then enable View so markers appear while you navigate the recording.
Example: Runnable — Events detection
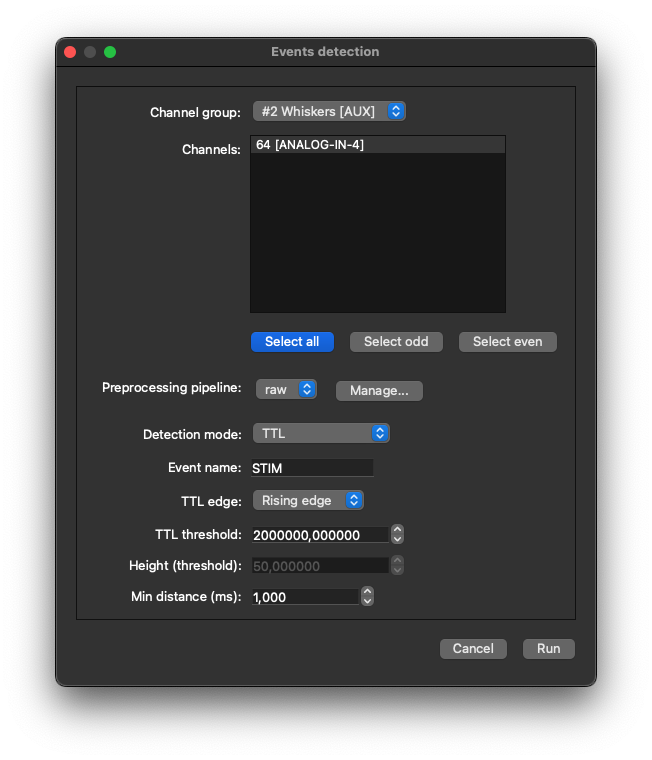
Events detection is a Runnable add-on that scans selected channels (TTL edge crossings or peaks above a threshold) and appends detections to the session event vocabulary. After it finishes, the new events appear in the signal panel and in the events table like manually placed labels.
For installing, searching, and running add-ons from the UI, see Usage. For scaffolding your own module, see Add-on Development.