Settings Panel
The right-hand settings panel holds tools that configure the view, describe the experiment, run add-ons, and inspect logs. Show or hide individual sections from View → Tools, or use the Panel button in the header bar to hide the entire panel.
GUI mode
At the top of the panel, choose Beginner mode or Expert mode.
The choice is stored in Ephyr’s global user settings and applied whenever you open the app. Expert mode reveals additional Channel Management controls (see below). All other menus and panels remain available in both modes.
Time settings
Part of Electrophys trace settings (View → Tools → Electrophys trace settings). Available in Beginner and Expert modes.
| Control | Purpose |
|---|---|
| Current sweep | Selects which sweep is displayed (1-based in the UI). Sample rate and sweep duration are shown underneath. |
| Start point index | Sample index where the visible time window starts. |
| Duration to show | Length of the visible window in milliseconds. Changing duration keeps the window center fixed when possible. |
| Auto-scroll time step | Step size (ms) used by the < / > buttons and by auto-scroll. |
| Auto-scroll interval | Timer interval (ms) between auto-scroll steps when << / >> is active. |
These values are stored in the session’s gui_setup and drive the signal panel and navigator.
Channel Management
Also under Electrophys trace settings. Use this section to organize electrodes into groups, apply filters, set units, and control how groups and channels are laid out on screen.
Global controls
| Control | Mode | Purpose |
|---|---|---|
| Number of dots to display | Expert only | Target number of plotted points after downsampling. Lower values improve performance; higher values show more detail. |
| Channels mapping image | Expert only | Attach a probe/array map via URL or local file (stored in the session). Preview appears in the panel; double-click opens a larger view; you can open the link externally. |
| Add channels group | Both | Creates a new empty channel-group tab. |
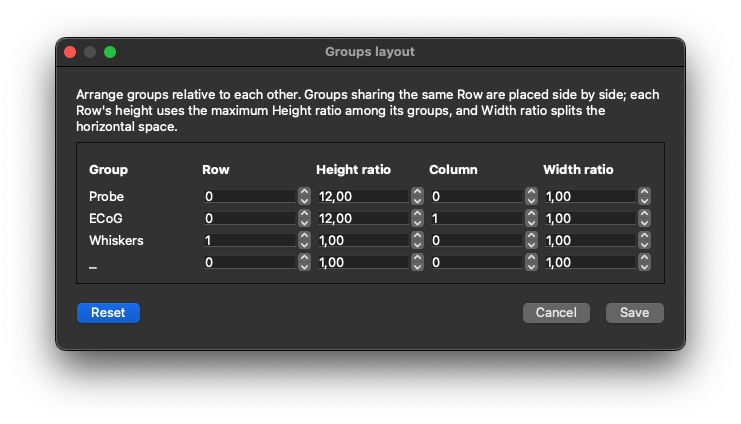
| Groups layout | Both | Opens a dialog to place groups on a shared grid (row, column, height ratio, width ratio). |
| Set units | Both | Opens header units management so you can change voltage units for selected channels. |
Groups layout
Groups layout controls how multiple channel groups share the signal panel:
- Groups on the same row appear side by side.
- Height ratio and width ratio allocate space within the row/column.
- Reset restores a simple default arrangement.
Per-group tabs
Each channel group has its own tab (tabs can be reordered; empty groups can be closed).
| Field / action | Purpose |
|---|---|
| Name | Title of the group. |
| View | Show or hide this group on the signal panel. |
| Cut traces | Clip drawn traces to each channel cell’s bounds. |
| Auxiliary channels | Marks the group as auxiliary. Auxiliary groups expose per-channel scale, Y offset, and color, and do not use the same “number to show” windowing as regular groups. Disabling a channel in an aux group can reset its style to defaults. |
| Group filters | Choose a filter type (Butterworth low/high/band-pass, Chebyshev band-pass, Notch), set parameters (cutoff, order, ripple, Q, and so on), and enable or disable each filter. Disable all turns every filter off for the group. |
| Common Scale / Y offset / Color | Applied to all channels in non-auxiliary groups. |
| Channel list | Enable checkbox, channel index and name, free-text Info field. Auxiliary rows also show per-channel Scale / Y / Color. |
| Layout | Opens the channel layout dialog for this group (order + optional grid). |
| Enable all / Disable all | Toggles the enabled set for the group. |
| Move selected to | Moves selected channels to another group. |
Channel layout
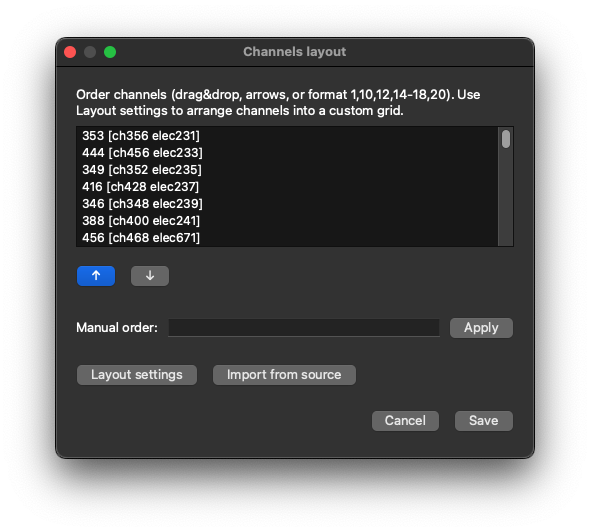
Click Layout on a group to open Channels layout:
- Reorder channels by drag-and-drop, up/down buttons, or a manual index list such as
1,10,12,14-18,20. - Import from source restores a preferred electrode order from the original recording when metadata is available (see below).
- Open Layout settings for the electrode grid editor.
- Save applies the new order and layout table to the group.
Import from source (channel order)
Import from source rebuilds the channel list order using format-specific metadata from the original source next to the *_ephyr folder (or a file/folder you pick if auto-resolve fails). Only channels in the current group are reordered; the set of channels is unchanged.
| Source type | Preferred order |
|---|---|
| NWB | Electrode coordinates (rel_x / rel_y, or x / y) |
| Intan RHS / RHD | Amplifier custom_order (then native_order); board ADC channels stay after amplifiers |
| XDAT | Port, then channel name |
| DAQ | Hardware channel number (HwChannel) |
| Neuralynx NCS | AcqEntName (synthetic Events channel last, if present) |
| EDF / ABF / Open Ephys | Natural sort of channel names from the header |
If a format has no richer key, Ephyr falls back to acquisition order as stored in the converted experiment.
Layout settings
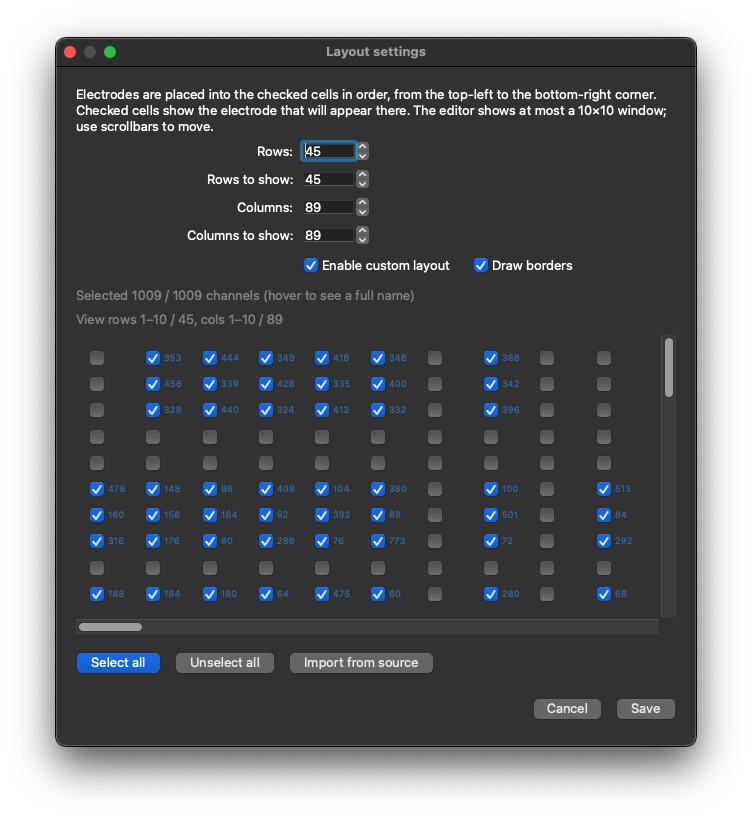
The Layout settings dialog configures a custom grid for the group:
| Control | Purpose |
|---|---|
| Rows / Columns | Full size of the electrode grid. |
| Rows to show / Columns to show | Visible window size (use the group minimap on the signal panel to pan). |
| Enable custom layout | Use the grid instead of a single-column classic stack. |
| Draw borders | Draw cell borders around channels on the plot. |
| Grid editor | Checked cells receive electrodes in channel order (top-left to bottom-right). The editor shows at most a 10×10 window of the full grid; use scrollbars to move across larger arrays. Select all / Unselect all apply to the whole grid. The number of checked cells must not exceed the number of channels in the group. |
| Import from source | Currently supported for NWB: builds the grid and occupied cells from electrode rel_x / rel_y (or x / y), enables custom layout, and updates the channel order to match the spatial filling order. |
Experiment description
Shown when View → Tools → Information is enabled.
A single free-text editor stores notes for the experiment/session (experiment_description in the
session JSON). Use it for protocols, animal IDs, or any free-form context you want next to the labels.
Add-ons
Shown when View → Tools → Add-ons is enabled.
Provides search, View / Transform checkboxes (when the add-on supports those capabilities), and a Run button for Runnable add-ons. See Add-ons Usage for install/manage workflows and Add-ons Workflow for how the three add-on types fit together.
Application Logs
Shown when View → Tools → Logs is enabled.
| Control | Purpose |
|---|---|
| Log list | Live, color-coded messages from the application logger (list size is capped). |
| Filter | Restrict by level: ALL, DEBUG, INFO, WARNING, ERROR, CRITICAL. |
| Clear | Clears the on-screen list. |
| Open | Opens the log file on disk in the system viewer. |