Main Window
When an experiment session is open, the Ephyr window is organized as follows.
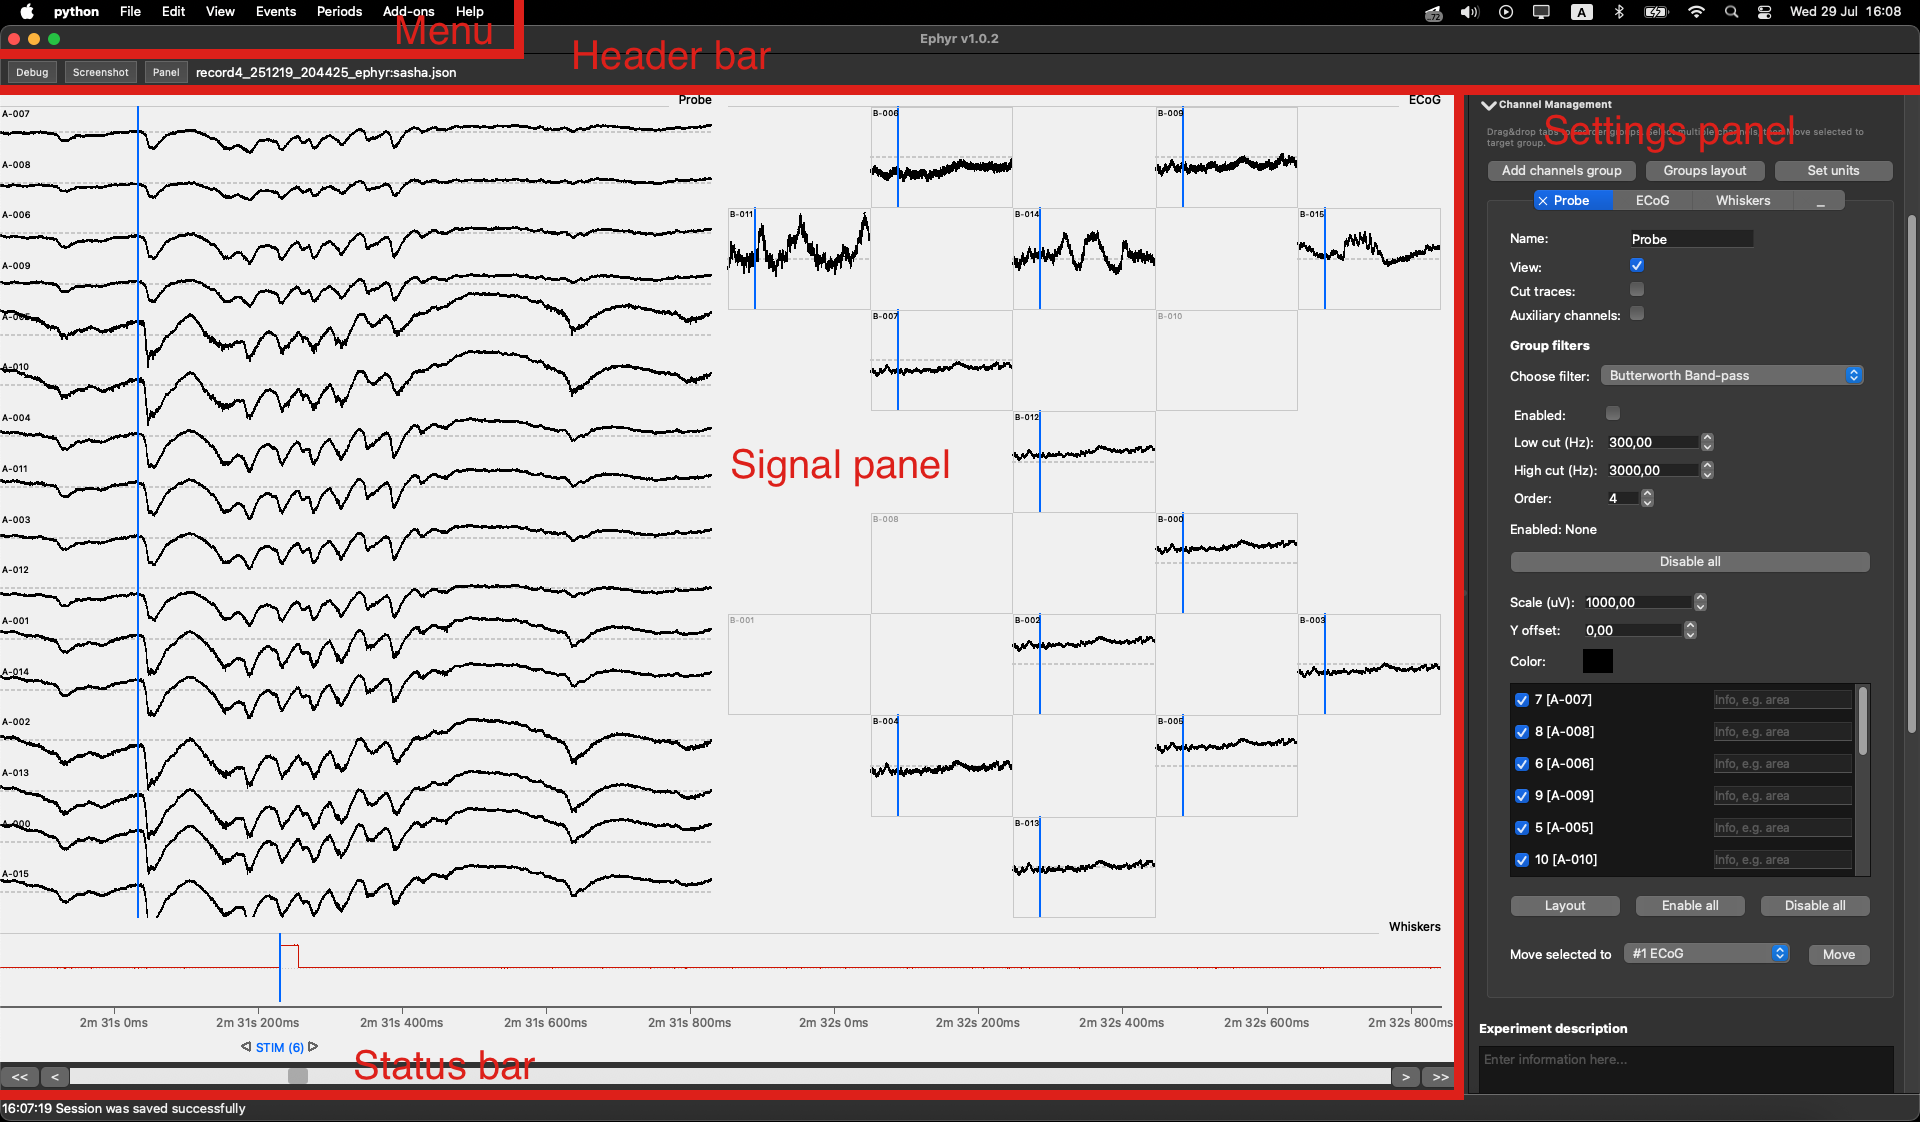
Layout overview
| Region | Role |
|---|---|
| Menu | Global actions: open experiments, manage sessions, toggle visibility, label events/periods, manage add-ons, and open Help. See Menu. |
| Header bar | Screenshot exports the current signal view (PNG/SVG). Panel shows or hides the right-hand settings panel. The label shows the current experiment and session name. |
| Signal panel (left) | Channel groups with traces, events, periods, optional add-on overlays, and time navigation. See Signal Panel. |
| Settings panel (right) | GUI mode, time and channel settings, experiment description, add-ons list, and application logs. See Settings Panel. |
| Status bar | Timestamped status messages from the application. |
Before any experiment is loaded, the left area shows a start screen with a quick Open action and a short hotkey list.
Signal panel highlights
Inside the signal panel you will typically work with:
- Channel groups — arranged traces for one or more electrode groups
- Events — point markers on the time axis
- Periods — labeled time intervals
- Tools — measurement bar, area selection, and interactive labeling modes
- Add-on overlays — drawings from Viewable add-ons (for example spike markers)
- Time controls — scrollbar, step buttons, and auto-scroll for navigating the recording
Settings panel highlights
The right panel starts with GUI mode (Beginner / Expert). Additional sections are toggled from View → Tools: Electrophys trace settings, Information, Add-ons, and Logs.